Disclaimer: The information in this article is intended for informational purposes only and should not be taken as personal financial advice.
QLD Backtest: Key Takeaways
- A $1,000 investment into QLD in 1999 would be worth $10,113 today.
- With a $100 monthly dollar cost average, you would have $1,012,595 today.
- With a $500 monthly dollar cost average, you would have $5,029,252 today.
Investing in QLD Before the Dot-Com Bubble
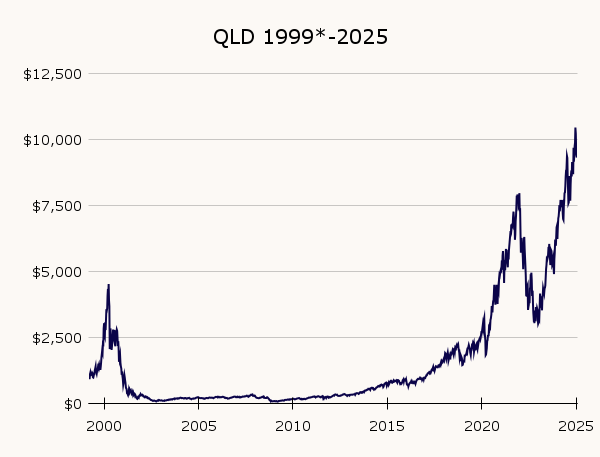
Investing in QLD (2x leveraged QQQ) can be both rewarding and challenging. Since its inception in 2006, it has delivered a solid 5,000% return. If you think a 50x return over the past few decades is too good to be true, just take a look at the all-time chart below.

The resilience of the US stock market over the last few decades has played a key role in QLD’s impressive performance. However, leveraged ETFs are particularly sensitive to market downturns, experiencing sharp declines in value and volatility decay.
Unlike other leveraged ETFs (TQQQ or SPXL), QLD has been around long enough to weather the 2008 Financial Crisis, offering some insight into how it performs in a severe downturn.
However, QLD was not yet available during the Dot-Com bubble of the early 2000s, when tech stocks suffered massive declines. This made me curious—how would QLD have held up if it had existed back then?
Using historical data from QQQ, I created a simulation for how QLD would have performed if it had been available before the Dot-Com bubble in 1999. Additionally, I examined scenarios involving consistent dollar cost averaging (DCA) during that time.
The results may surprise you!
Methods for Backtesting QLD Before the Dot-Com Bubble
To estimate QLD’s performance before its inception in 2006, I used the following methodology and assumptions:
- Data Source: QQQ’s daily historical data was exported from Thinkorswim.
- Calculation Method: Assumed that QLD’s daily return rate is exactly 2x that of QQQ.
- Expense Ratio (ETF Fees): QLD’s current expense ratio (0.95%) was subtracted annually from the simulated value.
Please note that this simulation serves as a general representation and is not 100% accurate. As such, the results should be viewed as illustrative rather than definitive.
For those interested in the detailed plot and full data sheet, click here. Feedback on improving the data is always welcome through my contact page.
QLD Backtest: How It Would Have Performed Before the Dot-Com Bubble
QLD’s has demonstrated strong historical performance since its introduction in 2006. However, let’s examine how a $1,000 investment into QLD before the early 2000’s Dot-Com bubble would have fared over time:
Scenario 1: No Additional Money Added
Total Invested: $1,000 | Current Balance: $10,113 | Percent Gain: +911%
If you invested $1,000 in QLD in 1999 and never added another penny, your investment would be worth $10,113 today. While you would still be up overall, the journey was anything but smooth.
During the 2008 financial crisis, your investment would have plummeted by 94%, dropping to just $64. Yes, you read that right—only $64 remained from your original investment. But here’s the incredible part: from that rock-bottom low, your money would have grown back to $10,113, a nearly 16,000% return over 17 years.
Scenario 2: $100 Monthly Contributions
Total Invested: $31,100 | Current Balance: $1,012,595 | Percent Gain: +3,157%
By consistently contributing just $100 per month, your initial investment would have grown to $1,012,595 today! This demonstrates the power of dollar cost averaging in leveraging long-term growth.

Scenario 3: $500 Monthly Contributions
Total Invested: $156,500 | Current Balance: $5,029,252 | Percent Gain: +3,116%
With $500 monthly contributions, your portfolio would have reached an incredible $5,029,252.

There are two main lessons from this analysis:
- QLD is very volatile: It experiences massive drops during recessions but rebounds dramatically during bull markets. The 2000 Dot-Com Bubble and the 2008 Financial Crisis are prime examples of this volatility.
- Dollar cost averaging wins: Consistently investing over time proved to be the best strategy. By purchasing shares at lower prices during downturns, investors positioned themselves for exponential gains during bull market recoveries.
QLD vs. QQQ Before the Dot-Com Bubble: Which ETF Delivered Better Returns
Many investors weigh the benefits of QQQ (Nasdaq-100) against QLD, its leveraged counterpart that seeks to deliver twice the daily returns of the same index.
Let’s break down the performance of both funds using the same investment scenarios and timeframe of 1999-2025:
| Initial Investment (1999) | 1. No Additional Money (2025) | 2. $100 Monthly Contribution (2025) | 3. $500 Monthly Contribution (2025) | |
|---|---|---|---|---|
| QQQ | $1,000 | $10,372 | $277,058 | $1,343,800 |
| QLD | $1,000 | $10,113 | $1,012,595 | $5,029,252 |
Because QLD employs 2x leverage, it amplifies both gains and losses. While it outperformed QQQ in most scenarios, it also carried higher risks.
If no additional money was added beyond the initial $1,000, QLD only outperformed QQQ by about 33%. This is because the massive gains of QLD during bull markets were counteracted by sharp declines and the effects of volatility decay from the Dot-Com Bubble and the 2008 Financial Crisis.
The key advantage of QLD lies in consistent periodic investments. Dollar cost averaging not only helped smooth out volatility, but it also let investors take advantage of the fund’s exponential growth during bull markets.
It is also worth noting that while QLD has shown strong performance, TQQQ (3x leveraged NASDAQ) has demonstrated significantly higher returns when dollar cost averaging. However, increasing your leverage also carries higher volatility, making it even more difficult to hold through downturns.
Is QLD a Good Investment for Long-Term Growth?
At first glance, the strategy seems simple—invest a few hundred dollars into QLD every month for decades, and you could become a millionaire.
However, reality is always more complicated. Many investors struggle with psychological barriers during market downturns. Staying committed to dollar cost averaging when your original investment is down 94% is easier said than done.
Moreover, past performance does not guarantee future results. While the U.S. stock market has historically rebounded from recessions, there are no assurances that this trend will continue indefinitely.
Despite the risks…
I believe QLD can be a good long-term investment for a portion of your portfolio. Its underlying asset, QQQ, is a well-diversified ETF with a proven history of consistent growth. I personally keep a small amount of QLD in my investment portfolio.
Conclusion: What the Dot-Com Bubble Taught Us About QLD Investing
If you had invested in QLD before the Dot-Com Bubble, your investment journey would have been filled with volatility. A lump-sum investment would have faced steep declines but still yielded solid long-term returns. On the other hand, dollar cost averaging would have turned consistent investments into substantial wealth.
QLD presents an exciting high-risk, high-reward opportunity. However, it requires investors to maintain discipline and a high tolerance for market swings. Those who stick to a structured investment plan are the ones most likely to succeed.
Happy investing!